Introducing VBStats for iPad™,statistical analysis software that will change the way you coach forever. Based on years of testing and development, in consultation with leading coaches in Australia, USA and Europe, PERANA SPORTS have developed what is arguably the most intuitive volleyball statistical analysis app on the market. Analysing the performance of your players has never been easier.
Key benefits of the software include:
- Intuitive interface – the easy to use menu system and interface takes only minutes to learn and allows for fast statistical input.
- Powerful coaching insights – player and team statistics can be accessed on the fly and help you make immediate coaching decision and changes.
- Suitable for training or competition – the app allows coaches to take a variety of statistics in games or training. Coaches can scale down the number of statistics taken to provide accurate and instantaneous information.
- Reports – VHStats allows coaches to access individual as well as team statistics across games and seasons. A variety of reports include box scores, hitting and serving charts, rotational analysis, set distribution, scoring trends, +/- reports etc

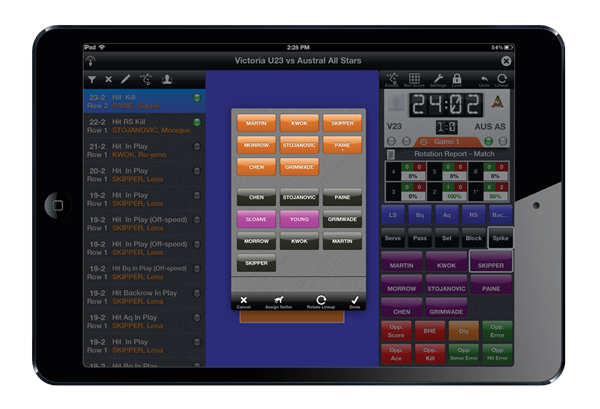
Line-Up Screen
This input screen allows you to substitute players, rotate line-up and assign setters. The one tap operation makes for quick and efficient actions between sets and games.
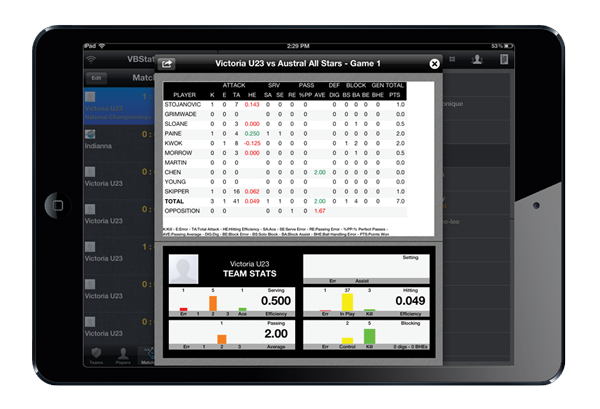
Box Score
Throughout the game you can access the box score screen. Statistics are dynamically updated and be viewed in the traditional manner or in graphical form. Individual players statistics can also be viewed. This is also accessible post-match and can be emailed or printed.
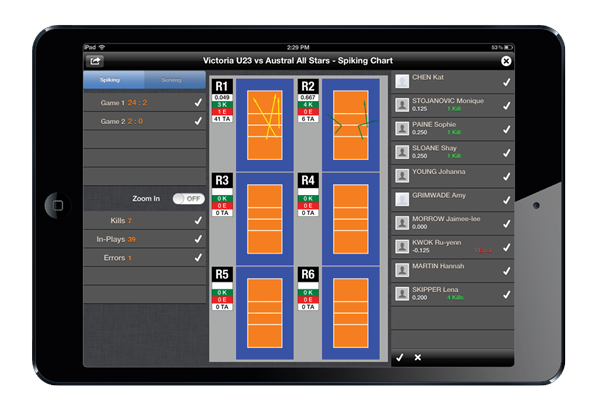
Spiking and Serving Charts
This screen can be viewed live during the game or post-game. All information can be filtered by skill (spiking/serving) and result. This can be viewed on a six-court rotational chart or collapsed into one court. You are able to further filter events by player or players. All charts can be emailed or printed from screen.
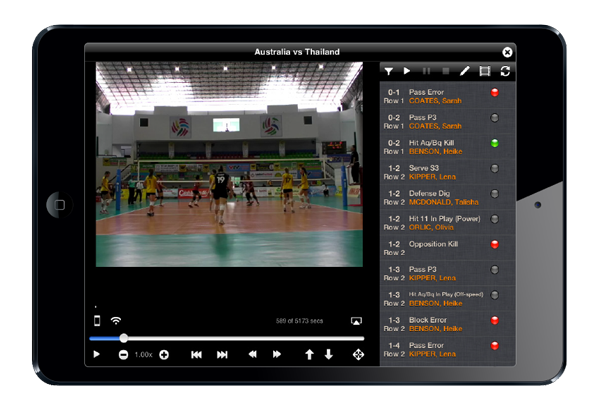
Video Analysis Screen
This consists of a video screen and an events list. Once a video has been synchronised with the statistics you can view the video and associated statistics on an events list. You can then filter events, view them on the screen of to an external source, as well as stitch video together for coaches and players.
Input Screen
All game statistics can be quickly and efficiently recorded from the input screen. The recording of statistics is intuitive so the next logical event in the sequence of skills will be activated. From this screen you also have the ability to view either the box score or the court-view where you can record the spike direction and serve direction as well as the results. Mini-reports (rotational reports, scoring trends & setting zones) can also be viewed. Substitution and time-out are also recorded.
