Serving/Spiking chart
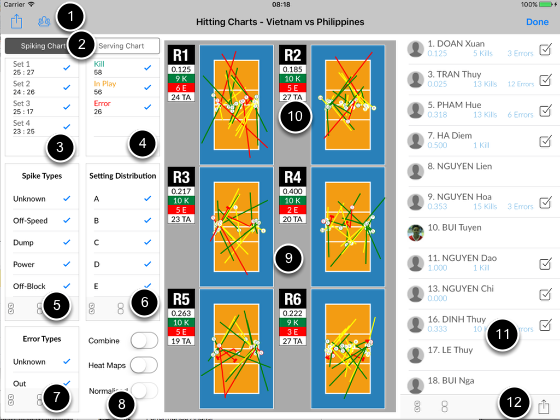
1. Toggle teams (if code both teams)
2. Select serving or spiking chart
3. Select set
4. Select results
5. Select hit type
6. Select setting zones
7. Select error types
8. Toggle
Combine = show all rotations on one chart
Heat Maps = instead of ball paths
Normalised = combine to show all shots from one side of the court
9. The charts
10. Stats for each rotation
11. Players list
12. Go to Attack scouting report
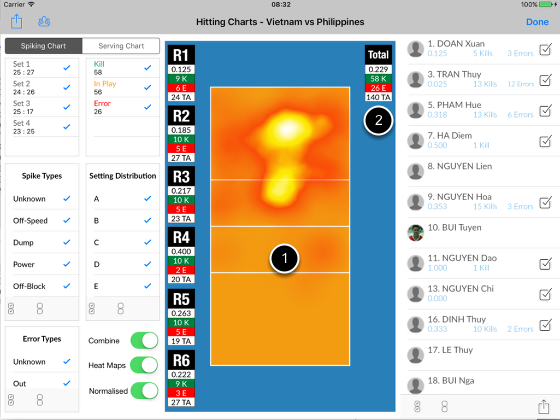
1. Combine chart showing heat map
2. Combine stats
Combine stats
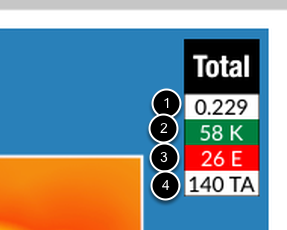
1. Efficiency = (K - E) / TA
2. Kills (K).
3. Errors (E).
4. Total attacks (TA).
Attack scouting report
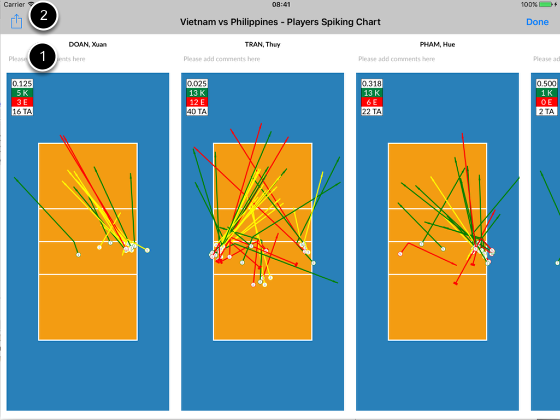
A convenient way to generate scouting report for selected players
1. Notes on player
2. Share report in PDF format